Friis-Christensen and Lassen (1991) showed Earth’s climate closely mirroring sunspot cycle durations between 1860 and 1990. But this was just a coincidence. Sunspot cycle durations since the paper was published have completely failed to correctly predict the Earth’s mean temperature.
The plot below is the key one from the 1991 paper. It shows two curves. The one using + is the sunspot cycle length whilst the curve with * is the temperature anomaly (i.e. difference from the 1951-1980 average).
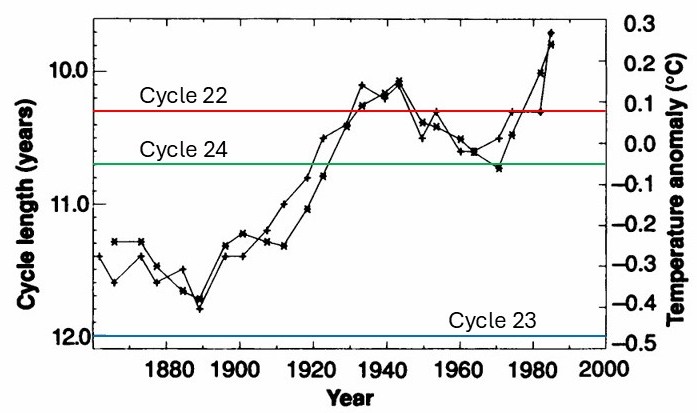
The close match between the two curves is really very impressive indeed. It’s not surprising that many of those seeking to delay action on climate change have latched onto this as an alternative explanation for global warming.
However, the hypothesis that temperature changes are linked to sunspot-cycle durations completely fails to predict future changes (i.e. what happened after 1991).
The graph below is taken from NOAA and shows the level of sunspot activity from late 1984 until early 2026.
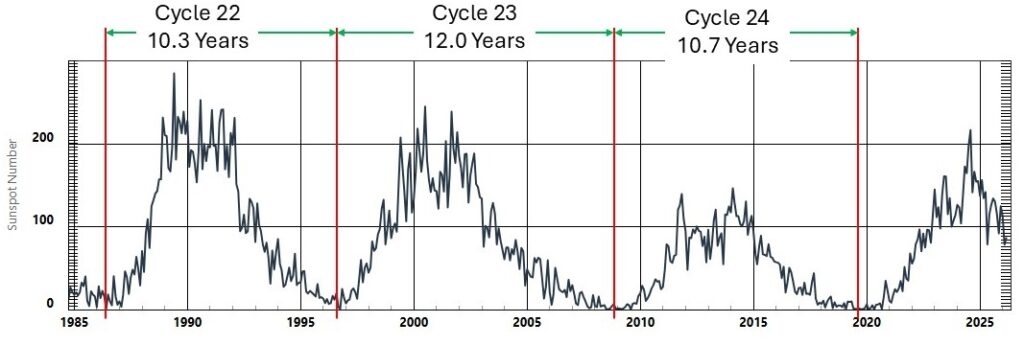
We’ve marked the lengths of the three most recent cycles onto this so that you can see that cycle 22 (1986-1996) lasted 10.3 years, cycle 23 (1996-2008) lasted 12 years and cycle 24 (2008-2019) lasted 10.7 years.
We’ve then put these durations onto the first graph on this page. You can see them as the horizontal lines marked cycle 22, cycle 23 and cycle 24.
These horizontal lines then give the predicted temperature anomalies for the two cycles, i.e. temperatures in 1986-96 (cycle 22) were predicted to be about 0.08 °C warmer than average, temperatures in 1996-2008 (cycle 23) should have been 0.47 °C colder than expected whilst the temperature anomaly in 2008-2019 (cycle 24) was predicted to be about -0.04 °C.
These predictions can then be compared to what actually happened. Using data from the UK Met Office, the cycle 22 anomaly was actually 0.30 °C (i.e. 0.22 °C warmer than predicted from sunspots), the cycle 23 anomaly was 0.53 °C (i.e. 1.0 °C than the sunspot prediction) and the cycle 24 anomaly was 0.76 °C (i.e. 0.8 °C warmer than sunspot cycles predicted).
Since 1991, there has been no correlation whatsoever between the sunspot-predicted temperature anomalies and those actually observed. The theory fails the key test of successful science – the ability to predict the outcomes of experiments or observations before they are made.